Introduction
In today’s fast-paced tech environment, monitoring your systems is critical. Tools like Prometheus and Grafana provide powerful, flexible solutions to monitor metrics and visualize data. In this guide, we’ll walk you through setting up Prometheus and Grafana for monitoring from scratch.
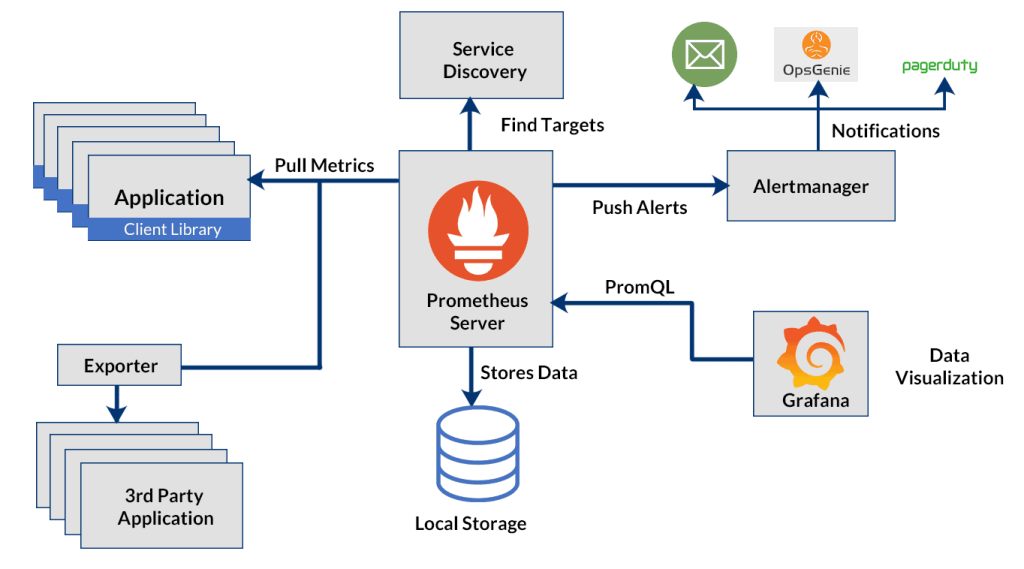
What Are Prometheus and Grafana?
- Prometheus: An open-source monitoring system that collects and stores metrics as time-series data. It’s ideal for recording real-time metrics and alerting.
- Grafana: A multi-platform analytics tool used for visualizing time-series data from databases like Prometheus.
Together, they create a robust monitoring stack that gives you visibility into your infrastructure and applications.
Why Use Prometheus and Grafana?
- Open-source and highly customizable.
- Scalable and efficient data collection.
- Powerful visualization capabilities.
- Easy integration with cloud-native environments like Kubernetes.
Prerequisites
Before starting, ensure you have:
- A Linux-based server (Ubuntu/Debian/CentOS recommended)
- Root or sudo access
- Basic knowledge of terminal commands
Step 1: Installing Prometheus
- Download Prometheus: bashCopyEdit
wget https://github.com/prometheus/prometheus/releases/download/v2.47.0/prometheus-2.47.0.linux-amd64.tar.gz - Extract the archive: bashCopyEdit
tar xvf prometheus-2.47.0.linux-amd64.tar.gz cd prometheus-2.47.0.linux-amd64 - Run Prometheus: bashCopyEdit
./prometheus --config.file=prometheus.yml - Access Prometheus:
Navigate tohttp://your_server_ip:9090in your browser.
Step 2: Installing Grafana
- Add the Grafana APT repository: bashCopyEdit
sudo apt-get install -y software-properties-common sudo add-apt-repository "deb https://packages.grafana.com/oss/deb stable main" - Install Grafana: bashCopyEdit
sudo apt-get update sudo apt-get install grafana - Start and Enable Grafana: bashCopyEdit
sudo systemctl start grafana-server sudo systemctl enable grafana-server - Access Grafana:
Visithttp://your_server_ip:3000and log in with default credentials (admin/admin).
Step 3: Integrating Prometheus with Grafana
- Log into Grafana and go to Configuration > Data Sources.
- Add Data Source and choose Prometheus.
- Set URL: arduinoCopyEdit
http://localhost:9090 - Click Save & Test to ensure Grafana can communicate with Prometheus.
Step 4: Creating Dashboards in Grafana
- Go to Dashboards > New Dashboard.
- Add a New Panel.
- Select your Prometheus data source.
- Write a PromQL query like: nginxCopyEdit
node_cpu_seconds_total - Customize the visualization (Graph, Gauge, Table, etc.)
You can also import ready-made dashboards from Grafana’s Dashboard Repository.
Best Practices for Monitoring Setup
- Secure Access: Use authentication and HTTPS for both Grafana and Prometheus.
- Alerts: Set up alerting rules in Prometheus for proactive monitoring.
- Retention Policies: Configure Prometheus to handle data retention according to your needs.
- Backup Configurations: Regularly back up both Prometheus data and Grafana dashboards.
Conclusion
Setting up Prometheus and Grafana for monitoring is one of the best investments for your infrastructure’s reliability and performance. With proper configuration and smart dashboards, you can detect issues early, plan for scaling, and maintain a healthy system.
Stay tuned for our next guide, where we’ll dive deeper into creating advanced Grafana dashboards!